OCEAN ACIDIFICATION LAB
COLLABORATORS
Ben Tiffany, Ryan Foster
INTRODUCTION AND PROBLEM
The Monterey Bay aquarium foundation, addressed the problem of ocean acidification in the article. Ocean acidification is the decrease in ph of the Earth's oceans due to increased uptake of CO2. Co2 is a natural occurring gas in the atmosphere that is vital in maintaining a healthy climate, but due to increased emissions due to increased burning of coal and fossil fuels the hydrogen ion concentration in the ocean has increased between 1751 and 1994. The ocean ph is estimated to have risen from 8.2 to 8.1, which is nearly 26% increase in acidity. The topic of ocean acidification is important because animals are losing a vital chemical that helps with shell and skeleton building. Solving the problem of ocean acidification could lead to saving thousands of animals.
HYPOTHESIS
If the uptake of CO2 into the ocean continues to increase the acidity of the ocean will continue to rise and some sea animals shall die off
PARTS OF THE EXPERIMENT
Independent Variable: Time, amount of C02
Dependent Variable: The ph of the water and the color of the water
Control Group: Distilled water
Experimental Group: Salt water
Controlled Variable: The amount of distilled and salt water, universal indicator
MATERIALS
2 test tubes
Universal indicator
Ocean water
Distilled water
Straw
Plastic pipet
METHOD
- Use a graduated to measure 10 ML oc ocean water. Pour it into test tube 1. Add 1ML of universal indicator. Stir and record ph in the test below
- Use a graduated cylinder to measure 10 ML of distilled water. Pour it into test tube 2. Add 1 ML of universal indicator. Stir and record ph in the table below
- Use a straw to exhale into test tube 1 and use a timer to time how long it takes for the ph (color) to change. Record your results in the table below
- Repeat procedure for the distilled water. Record your results below
- Add crushed calcium carbonate to the ocean water and distilled water test tube. Record your results
|


|
Data Analysis
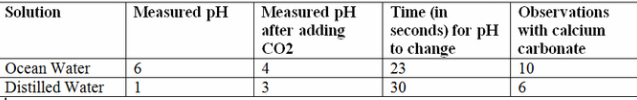
The ph of the ocean water started out at 6, after the CO2 was added it dropped to 4. When the calcium carbonate was added, it took 23 seconds for the ph to rise to 10. The ph of the distilled water started out at 1, after the CO2 was added the ph rose to 3. When the calcium carbonate was added it took 30 seconds for the ph to rise to 6.
The ph of the ocean water started out at 6, after the CO2 was added it dropped to 4. When the calcium carbonate was added, it took 23 seconds for the ph to rise to 10. The ph of the distilled water started out at 1, after the CO2 was added the ph rose to 3. When the calcium carbonate was added it took 30 seconds for the ph to rise to 6.
CONCLUSION
The ocean acidification is a bad problem and it will get worse if actions are not taken to stop it. The increase of hydrogen ions in the water has very detrimental effects all the sea life that need the chemicals that bind to hydrogen ions. According to the lab, the amount of C02 directly correlates with the acidity of the water and if more CO2 is added the acidity will only increase. To stop this problem it would be best if we lowers our emissions and did not burn as much fossil fuels.
Citation
"Ocean Acidification." Wikipedia. Wikimedia Foundation, 09 Feb.
2014. Web. 06 Sept. 2014.
- The most common ph of surface ocean water is approximately 8.1
- The ph of the ocean water in the experiment is 6, this differs from the common ph pf surface ocean water because the ocean water was artificially created, so differences in ph levels are to be expected
- Yes, the distilled water and the ocean water reacted differently to the CO2. When the CO2 was added to the ocean water the ph decreased from 6 to 4. When the CO2 was added to the distilled water the ph increased from 1 to 3.
- When the calcium carbonate was added to the water samples it increased the ph of both water samples. The ocean water from 4 to 10 and the distilled water from 3 to 6.
- I do not feel the experiment was a valid model for ocean absorption of CO2. I believe the way the ocean absorbs CO2 is grossly different from the way we added to CO2 to the water samples; so the experiment is not an accurate representation
The ocean acidification is a bad problem and it will get worse if actions are not taken to stop it. The increase of hydrogen ions in the water has very detrimental effects all the sea life that need the chemicals that bind to hydrogen ions. According to the lab, the amount of C02 directly correlates with the acidity of the water and if more CO2 is added the acidity will only increase. To stop this problem it would be best if we lowers our emissions and did not burn as much fossil fuels.
Citation
"Ocean Acidification." Wikipedia. Wikimedia Foundation, 09 Feb.
2014. Web. 06 Sept. 2014.
CATCH AND RELEASE LAB
COLLABORATORS
The entire class
INTRODUCTION/PROBLEM
In this lab, the topic addressed was a population measurement called tagging. Tagging involves placing tags (stickers, ear clips or notching made in fish fins) on animals to track migration patterns, health and population of a certain species in an area (DFG.CA). Tagging works by capturing and tagging a sample of a certain species , then releasing that sample and letting them spread and naturally. After that biologist taking random samples of that species determine the percent tagged and used that to estimated the population of that species in that area. The question that arises is; is tagging an accurate method for estimating population size?
HYPOTHESIS
If a random sample of a species is captured and tagged, then a combination of both a large number of tagged species and a large number of catches will give the most accurate estimate of the size of the species' population.
PARTS OF THE EXPERIMENT
1) Remove a sample catch of 10 fish from the population in the ocean bag.
2) Substitute fish of a different color for each captured fish to represent tagging the captured fish, then return these tagged fish to the ocean bag. Record the original number tagged in the table.
3) Shake the bag and without looking remove a sample catch from the population in the bag. Record the total number of fish caught and the number of tagged fish caught in this sample catch.
4) Repeat this for a total of 10 catches.
5) Calculate the percent tagged for each catch and average that column.
6) Calculate the estimated population size using the formula:
Population Size = Number Tagged / Mean of the Sample Percentages
7) Count the actual population.
8) Calculate the percent error between your estimated population and the actual population.
9) Compare your numbers with those of your classmates to test your hypothesis.
DATA
DATA ANALYSIS
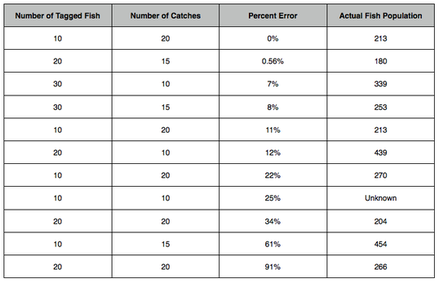
Looking at the class data it was clear to see that some groups did differently than other groups. This is evident because of the wide range of percent errors, ranging from 0-91. These numbers are outliers though and were not paid that much attention too in the lab analysis. These outliers could have been cause by miscalculations or simply to differing handfuls sizes when the fishes were caught. What was clear was that the the amount of tagged roles played a more significant role in how accurate population estimates were. The group that had 20 tagged fish and 15 catches had a .56 % error and the group with 10 tagged fish and the same number of catches had a 61% error. The group with the most tagged fish gave the most accurate population estimate.
CONCLUSION QUESTIONS
The hypothesis that was originally tested by this experiment was proved incorrect. Tagging is not an accurate way to measure population size due to the disparity in class data and the weak correlation of tagged fish and catch size to accurate population estimates. In the experiment, there were three groups with 10 number of fish tagged and 20 number of catches. There percent error were 0%, 11%, and 34%. It was clear that number of catches played a weak role in the accuracy of the results. A group with 30 tagged fish and 10 number of catches had a percent error of 7%, while another group with 10 tagged fish and 10 number of catches had a percent error of 25%. It was seen that number of tagged fish affected the accuracy of population size more than other factors. This method is not a very accurate one and if biologist use it they should be aware that large catch sizes increase the accuracy of results and they should watch out for factors like migration, births, and overfishing
CITATIONS
"Fisheries, Fishing, Bluefin Tuna, Oceans- National Geographic." National Geographic. N.p., n.d. Web. 15 Sept. 2014.
"Related Links." Fish Tags. N.p., n.d. Web. 15 Sept. 2014.
The entire class
INTRODUCTION/PROBLEM
In this lab, the topic addressed was a population measurement called tagging. Tagging involves placing tags (stickers, ear clips or notching made in fish fins) on animals to track migration patterns, health and population of a certain species in an area (DFG.CA). Tagging works by capturing and tagging a sample of a certain species , then releasing that sample and letting them spread and naturally. After that biologist taking random samples of that species determine the percent tagged and used that to estimated the population of that species in that area. The question that arises is; is tagging an accurate method for estimating population size?
HYPOTHESIS
If a random sample of a species is captured and tagged, then a combination of both a large number of tagged species and a large number of catches will give the most accurate estimate of the size of the species' population.
PARTS OF THE EXPERIMENT
- There is no control group.
- The experimental group consists of every group's fish population.
- The independent variable is the number of tagged organisms and the number of catches.
- A possible confounding variable is the size of the catch samples.
- The dependent variable is the accuracy of the estimate of the size of the species' population.
- The controlled variables are the materials.
- random number of black beads
- assigned number of colored beads (10)
- paper bag
1) Remove a sample catch of 10 fish from the population in the ocean bag.
2) Substitute fish of a different color for each captured fish to represent tagging the captured fish, then return these tagged fish to the ocean bag. Record the original number tagged in the table.
3) Shake the bag and without looking remove a sample catch from the population in the bag. Record the total number of fish caught and the number of tagged fish caught in this sample catch.
4) Repeat this for a total of 10 catches.
5) Calculate the percent tagged for each catch and average that column.
6) Calculate the estimated population size using the formula:
Population Size = Number Tagged / Mean of the Sample Percentages
7) Count the actual population.
8) Calculate the percent error between your estimated population and the actual population.
9) Compare your numbers with those of your classmates to test your hypothesis.
DATA
DATA ANALYSIS
Looking at the class data it was clear to see that some groups did differently than other groups. This is evident because of the wide range of percent errors, ranging from 0-91. These numbers are outliers though and were not paid that much attention too in the lab analysis. These outliers could have been cause by miscalculations or simply to differing handfuls sizes when the fishes were caught. What was clear was that the the amount of tagged roles played a more significant role in how accurate population estimates were. The group that had 20 tagged fish and 15 catches had a .56 % error and the group with 10 tagged fish and the same number of catches had a 61% error. The group with the most tagged fish gave the most accurate population estimate.
CONCLUSION QUESTIONS
- In the experiment, a contributing factor that could cause the population size estimate to be different from the actual population size, could be the catch size for each catch was always the same size. Different people with different hand sizes picked up the catches and that could cause the data to be skew. In real life, contributing factors could be that sometimes the catches have all tagged fish and sometimes the catch could have not tagged fish. Other factors could be a sudden death of the species tagged, overfishing of the species tagged, and increased migrations of the species tagged. These would all skew data.
- The size of the catch sample compared to the actual size of the population can affect population estimates because the larger the catch size the more accurate the prediction. In the experiment, when 105 fish were caught 4 of them were tagged and were 27 fish were caught only 1 was tagged. The probability of catching a tagged fish increases when the catch size is bigger, so small catch sizes skew data.
- The number of catches can affect the results because generally a number of representatives of a population increases the accuracy of an experiment. In the experiment the number of catches did not play that significant of a role, and the most significant part was the number of tagged fish. The number of tagged fish tended to affect percent error more than the number of catches. For example one group had 30 tagged fish, 10 catches and a 7% error and another group had a 10 tagged fish, 10 catches and 25% error. The number of tagged fish affected how accurate the population estimate was more than the number of catches
- No, this method does not seem like an effective way to assess population size. There is not a strong correlation between the number of tagged fish and catch size and the actual population. Also there is disparity between groups that had the same number of tagged fish and same number of catches. There were three groups with 10 number of fish tagged and 20 number of catches. There percent error were 0%, 11%, and 34% . This disparity could be caused by a larger or smaller number of drawn tagged fish causing one groups' data to more accurate than another groups'.
- According to Fun Montaign from the National Geographic "The world's oceans are a shadow of what they once were...the number of fish swimming the seas is a fraction of what it was a century ago". If biologist were trying to tag fish in an area such as this, results would be skew because biologist would have such a wide area to cover that contains few fish. Catch sizes would be smaller, as we have learned from the data bigger catch sizes have a good correlation to accurate population estimates. The percent area would be large.
- A biologist should take in be concerned with the migration patter of the species it is tagging because that could skew its data. If it tagged fish in the spring and tried to catch them in the winter, the majority of the fish would have migrated south for warmer waters. A biologist should also be concerned with when the species has their offspring. This would skew data because it would lower the tagged to untagged ratio of fish.
The hypothesis that was originally tested by this experiment was proved incorrect. Tagging is not an accurate way to measure population size due to the disparity in class data and the weak correlation of tagged fish and catch size to accurate population estimates. In the experiment, there were three groups with 10 number of fish tagged and 20 number of catches. There percent error were 0%, 11%, and 34%. It was clear that number of catches played a weak role in the accuracy of the results. A group with 30 tagged fish and 10 number of catches had a percent error of 7%, while another group with 10 tagged fish and 10 number of catches had a percent error of 25%. It was seen that number of tagged fish affected the accuracy of population size more than other factors. This method is not a very accurate one and if biologist use it they should be aware that large catch sizes increase the accuracy of results and they should watch out for factors like migration, births, and overfishing
CITATIONS
"Fisheries, Fishing, Bluefin Tuna, Oceans- National Geographic." National Geographic. N.p., n.d. Web. 15 Sept. 2014.
"Related Links." Fish Tags. N.p., n.d. Web. 15 Sept. 2014.
